The 10 Fasting Biomarkers to Track for Metabolic Health

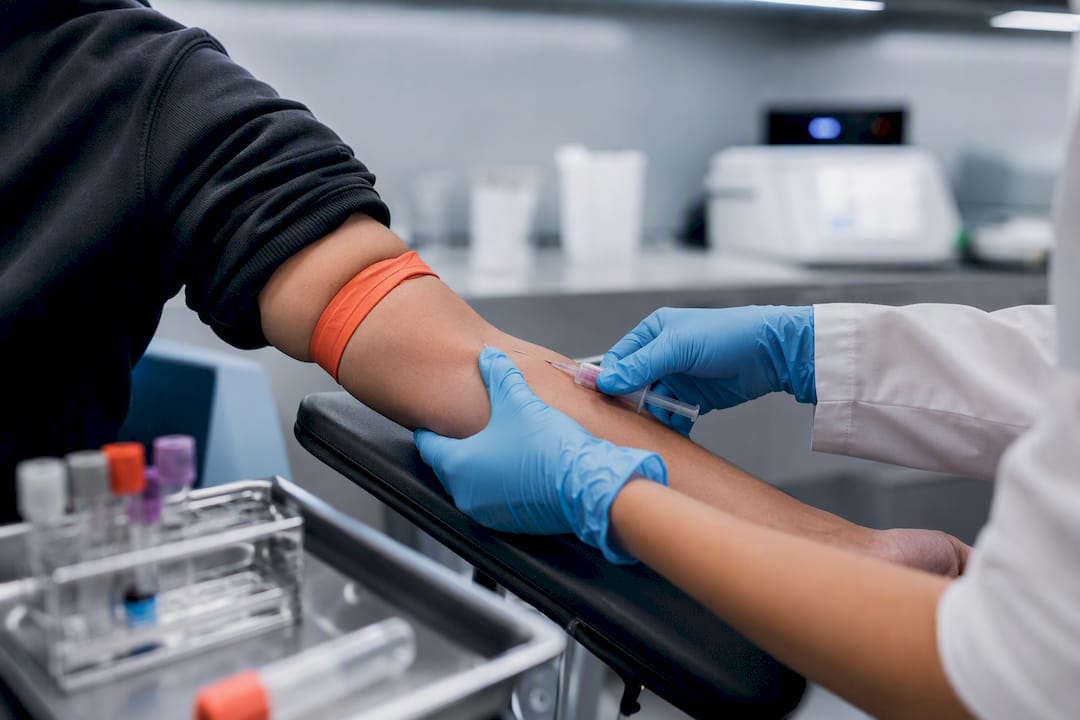
The fasting biomarkers to track that actually tell you whether metabolic switching is working are fasting insulin, fasting glucose, HbA1c, beta-hydroxybutyrate (BHB), a full lipid panel with triglycerides, hs-CRP, liver enzymes (ALT/AST/GGT), uric acid, C-peptide (for HOMA-IR), and ApoB or LDL-P where your lab offers it. Each one answers a different question about what your body is doing when it shifts from burning glucose to burning fat for fuel.
Here’s the one-line reason each earns a spot on your test order:
Fasting insulin — the earliest signal of insulin resistance, often shifting years before glucose does
Fasting glucose — your baseline fuel status, but a lagging indicator on its own
HbA1c — your three-month glucose average, catching trends daily readings miss
Beta-hydroxybutyrate (BHB) — the direct chemical proof that metabolic switching is happening
Triglycerides and full lipid panel — a fast-moving marker of how well fasting is improving fat metabolism
hs-CRP — your systemic inflammation gauge, often responsive to fasting within weeks
ALT/AST/GGT — liver enzymes that flag both fasting benefit and fasting stress
Uric acid — an early mover during ketosis that needs watching, not ignoring
C-peptide (for HOMA-IR) — a cleaner read on insulin secretion when insulin assays vary
ApoB or LDL-P — a more precise cardiovascular risk marker than standard LDL-C
Pull a baseline panel under consistent conditions (same time of day, same fasting duration, no exercise the day before), then repeat the same panel in 8 to 12 weeks. That single habit turns a pile of numbers into a real trend line.
Key Takeaways
Tracking fasting insulin, BHB, and HbA1c together over an 8 to 12 week window reveals whether metabolic switching is producing real, sustained change.
Point | Details |
Prioritize insulin first | Fasting insulin and HOMA-IR often reveal insulin resistance years before glucose does. |
Confirm ketosis directly | Blood BHB between 0.5 and 1.5 mmol/L confirms metabolic switching; a single high reading isn’t a red flag. |
Don’t panic over enzyme bumps | Transient ALT/AST/uric acid rises after exercise or early fasting usually resolve; retest before assuming harm. |
Test on a schedule | Baseline, then repeat at 8 to 12 weeks, then every 3 to 6 months for ongoing tracking. |
Know what labs can’t show | Routine blood tests cannot directly measure autophagy; they only offer indirect clues like low insulin and elevated BHB. |
Short, Authoritative Links for Clinicians and Curious Readers
Table of Contents
Fasting Biomarkers to Track: What Each One Really Tells You
Metabolic switching, the shift from glucose-burning to fat and ketone-burning, is the biological event fasting is actually trying to trigger. The biomarkers below are how you confirm it’s happening instead of just hoping.
Fasting insulin and HOMA-IR
Fasting insulin is arguably the single most useful number on this list, because insulin resistance shows up here long before it shows up in glucose readings. Insulin commonly signals metabolic trouble years before fasting glucose budges, which is exactly why relying on glucose alone gives you a false sense of security.
Rough targets often cited in metabolic health circles put optimal fasting insulin in a generally lower range, though labs vary and “normal” reference ranges are set far too loosely to catch early resistance. HOMA-IR, calculated from fasting glucose times fasting insulin divided by 405, gives you a composite insulin sensitivity score. Lower values typically indicate better insulin sensitivity, though exact numeric cutoffs vary. The formula has a real limitation, though: insulin assays differ between labs, so a HOMA-IR calculated from one lab’s insulin number isn’t always comparable to another’s. If you’re tracking trends, stick with the same lab.
Fasting glucose and HbA1c
Fasting glucose tells you what’s happening right now; HbA1c tells you what’s been happening for the last three months, since it measures the percentage of your red blood cells with glucose attached. Normal fasting glucose is typically considered as below a threshold generally recognized as healthy, with higher values indicating risk states. HbA1c below a conventional cutoff is seen as normal, with elevated percentages suggesting prediabetes or diabetes.
The two markers matter together because glucose can look fine on a single morning while HbA1c reveals a slower upward drift; or vice versa if you’ve had an unusually strict week before testing. Neither one, alone, tells you whether fasting is improving your insulin sensitivity. That’s what the insulin number is for.
Beta-hydroxybutyrate: your direct ketone readout
BHB is the most reliable circulating ketone body for confirming metabolic switching is actually underway, and it’s the only marker on this list that measures the event directly rather than inferring it. Nutritional ketosis, the state most fasting protocols are chasing, commonly falls between 0.5 and 1.5 mmol/L.

Statistic callout: Blood BHB testing (fingerstick meters or lab draws) measures D-beta-hydroxybutyrate directly and gives faster, more accurate readings than urinary ketone strips, which only detect acetoacetate semiquantitatively and become less reliable the longer you’ve been fasting.
Ketones aren’t just fuel, either. They function as signaling molecules that influence gene expression and neuroimmune pathways, which is part of why longevity researchers care about BHB levels beyond simple energy accounting.
Lipid panel and triglycerides
Triglycerides tend to respond faster to fasting than LDL cholesterol does, often dropping as your body shifts toward burning fat. A standard lipid panel gives you total cholesterol, HDL, LDL, and triglycerides, but the LDL-C number reported on most panels is a calculated estimate, not a direct measurement.
If your lab offers ApoB (a direct count of the atherogenic lipoprotein particles) or LDL-P (particle number via NMR), request one. These measures can provide more precise cardiovascular risk information than LDL-C alone. This distinction may be more relevant for longevity-focused readers.
hs-CRP and inflammation
High-sensitivity C-reactive protein measures systemic inflammation, and it’s one of the markers where fasting research shows genuinely encouraging patterns. Intermittent fasting and energy restriction interventions have demonstrated measurable changes in metabolic syndrome biomarkers including inflammatory markers over the course of structured trials.
An hs-CRP reading can indicate levels of systemic inflammation, with lower levels generally associated with lower cardiovascular risk. Single elevated readings may reflect transient conditions; trends over weeks are more informative.
Liver enzymes: ALT, AST, and GGT
ALT and AST often rise slightly in the early weeks of fasting or rapid weight loss, which alarms people who assume any enzyme elevation signals liver damage. In most cases, it’s transient, tied to fat mobilization from the liver itself, and should be confirmed with a repeat test before you draw any conclusions.
GGT is worth adding because it’s more specific to bile duct and alcohol-related liver stress, and a declining GGT over months of fasting is a genuinely good sign. Persistent elevation of ALT or AST beyond 2 to 3 times the upper limit of normal, though, isn’t something to wait out. That warrants a conversation with a physician, not another self-test.
Uric acid
Uric acid frequently climbs during the first weeks of fasting or ketosis, a well-documented and mostly benign pattern tied to changes in kidney handling of urate during ketone production. Transient rises in uric acid during early fasting or weight-loss phases are common and typically resolve, but they deserve a repeat test rather than a dismissal, particularly if you have any history of gout or kidney stones.
C-peptide and HOMA-IR refinement
C-peptide is released in equal amounts to insulin during production but clears the body more slowly and isn’t affected by insulin injections, which makes it a useful cross-check when insulin assay variability is a concern. If your fasting insulin number looks surprising, a C-peptide test can help confirm whether your pancreas is genuinely producing less insulin or whether the lab assay is the issue.
Advanced and optional markers
IGF-1 and IGFBP-1 come up frequently in longevity-focused fasting discussions because IGF-1 tends to drop during extended fasts, a pattern some researchers link to autophagy and cellular repair pathways. These aren’t markers most people need to add to a standard panel, and interpretation requires more nuance than a simple “lower is better” framing.
Neurofilament light chain (NfL) occasionally appears in advanced longevity panels as a marker of neuronal damage, but it’s not something to order without a specific clinical reason. For most fasting-focused readers, it adds cost without adding actionable information.
Sex and age caveats worth flagging across the board: women often show different ketone trajectories and insulin responses to fasting than men, so benchmarking against your own baseline over time matters more than comparing your numbers to a generic chart. Anyone on diabetes medication, anyone pregnant, and anyone with a history of eating disorders should loop in a clinician before starting a fasting protocol paired with lab tracking.
How to Get Fasting Labs That Actually Mean Something
Bad sample timing ruins good biomarker data. A few pre-test rules turn a lab result into something you can actually trust and compare over time.
Fast consistently before the draw. Most standard panels want 8 to 12 hours of true fasting, water only. Pick a duration and repeat it every time you test.
Skip hard exercise for 24 to 48 hours beforehand. Intense training transiently elevates liver enzymes and can shift glucose and inflammatory markers, muddying your results.
Test at the same time of day. Cortisol and glucose both follow circadian patterns, so a 7 a.m. draw and a 2 p.m. draw aren’t directly comparable.
Log your medications and supplements. Note anything that could shift the numbers, including over-the-counter anti-inflammatories, before you interpret a change as fasting-driven.
Choose your test setup deliberately. A standard comprehensive metabolic panel plus lipids and HbA1c covers the basics; add fasting insulin and C-peptide for the insulin-sensitivity picture, and either a blood BHB draw or a reliable fingerstick ketone meter for metabolic switching confirmation.
Home fingerstick ketone meters are convenient and reasonably accurate for tracking trends, but calibration varies by brand, and they’re not interchangeable with lab-drawn blood BHB for precision. A continuous glucose monitor (CGM) adds a different kind of value entirely: it shows you glucose patterns across a fasting window rather than a single point in time, which pairs well with periodic lab draws for insulin and lipids.
Pro Tip: Order your fasting insulin and glucose from the same blood draw, not separate visits days apart. Even small day-to-day variation in food, sleep, or stress can shift both numbers enough to distort your HOMA-IR calculation.
One safety note that applies broadly: anyone on SGLT2 inhibitors, insulin, or other glucose-lowering medications needs specific guidance from their prescriber before combining those drugs with extended fasting. Pregnant readers and anyone with a diagnosed metabolic condition should treat this entire framework as educational, not a substitute for medical supervision.
Reading Your Results Without Overreacting to Noise
One data point is a snapshot; a trend is information. The single biggest mistake in fasting biomarker tracking is treating a one-off reading, especially a ketone or liver enzyme value, as a verdict rather than a data point in a longer story.
Fasting insulin and HOMA-IR values are useful indicators for insulin sensitivity, with lower values generally indicating better metabolic health, though exact targets vary by lab.
BHB between 0.5 and 1.5 mmol/L marks nutritional ketosis; higher isn’t automatically better, and values above 3.0 mmol/L outside a supervised therapeutic context warrant a check-in with a clinician.
HbA1c values below a standard cutoff are considered normal, and small reductions over months can reflect meaningful improvements in glycemic control.
Statistic callout: Fasting biomarker models that combine glucose, insulin, HbA1c, and lipid data from a single fasting sample can estimate insulin sensitivity more reliably than any one marker read in isolation, which is the entire case for testing a panel instead of a single number.
Give any protocol 8 to 12 weeks before you judge it by lab numbers. Insulin and triglycerides can shift within a month, but inflammatory markers and liver enzymes need a longer runway to separate a real trend from weekly noise. The most common misreads: treating a single elevated ketone reading as dangerous (it usually isn’t, in a healthy adult), panicking over a liver enzyme bump after a hard workout instead of retesting after rest, and forgetting that dehydration alone can concentrate blood values and skew several markers at once. When a number looks alarming, retest under clean conditions before you act on it.
Building Your Testing Schedule: Baseline Through Advanced Tracking
A monitoring plan only works if it’s simple enough to actually follow. Here’s a structure that scales from a first-time tracker to someone running a longevity-focused protocol for years.
Baseline panel (week 0): fasting insulin, fasting glucose, HbA1c, full lipid panel with triglycerides, ALT/AST/GGT, hs-CRP, uric acid, and a BHB reading if you’re already fasting regularly. This is your reference point, so accuracy matters more than speed here.
First follow-up (8 to 12 weeks in): repeat the exact same panel, same lab, same pre-test conditions. This is where you find out whether the protocol is producing real change.
Ongoing cadence (every 3 to 6 months): once you have a trend established, testing every quarter to twice a year is generally sufficient unless you’re on medication that requires closer monitoring or you’re adjusting your fasting protocol significantly.
Advanced tracking: readers running longer fasts or more aggressive protocols often add a CGM for continuous glucose data, serial BHB checks across a single fasting window to map their personal ketosis curve, and occasionally ApoB or C-peptide for deeper insulin and lipid resolution.
When to involve a specialist: persistent liver enzyme elevation, HbA1c trending toward the diabetic range, or any unexplained symptom alongside abnormal labs should move you from self-tracking to a clinical workup.
What Blood Tests Can’t Tell You About Autophagy
Autophagy, the cellular cleanup process fasting is often credited with triggering, cannot be directly measured by routine blood tests. Clinical and research labs assess autophagic flux through markers like LC3-II and p62 in tissue or cell samples, not through anything a standard blood panel reports.
What your bloodwork can offer is a set of indirect clues: low fasting insulin, elevated BHB, falling triglycerides, and reduced hs-CRP together paint a picture consistent with the metabolic state where autophagy is believed to be active. None of those markers proves autophagy is happening at any given moment. They describe the metabolic environment associated with it.
Ketones function as both an energy substrate and a signaling molecule, meaning a rising BHB level reflects more than fuel switching. It reflects a genuine shift in cellular signaling and gene expression that researchers are still mapping to longevity pathways.
ForgeFast’s protocol structure leans on this exact distinction: consistent, sport and lifestyle-tailored fasting windows paired with insulin-focused education, rather than promising a direct autophagy readout no consumer test can deliver. If your bloodwork shows a genuinely abnormal result, especially in liver enzymes, glucose, or kidney markers, that’s a conversation for a clinician, not an app.
Pro Tip: Track the pattern across four markers together (insulin, BHB, triglycerides, hs-CRP) rather than fixating on any single number. The pattern is the closest proxy you have to confirming metabolic switching is doing its job.
Electrolytes and Hydration: The Markers Fasting Actually Disrupts
Sodium, potassium, and magnesium shift measurably during extended fasting, largely because reduced insulin lowers sodium retention in the kidneys, which pulls water and electrolytes out with it. This is the actual mechanism behind the headaches, cramping, and fatigue people report in the first few days of a longer fast.

Standard blood electrolyte panels (part of most comprehensive metabolic panels) will usually show sodium and potassium within normal range even when you’re symptomatic, because the body works hard to keep serum levels stable until the imbalance is severe. That’s the catch: normal blood electrolytes don’t rule out a functional deficit that’s making you feel terrible.
Hydration status is easier to self-monitor than electrolytes. Urine color, thirst, and steady body weight are reasonable day-to-day indicators; a BUN-to-creatinine ratio on your renal panel (covered below) offers a more objective secondary check. If you’re doing extended fasts beyond 24 hours, adding unsweetened electrolytes, particularly sodium and potassium, is a practical step, not an optional luxury. Magnesium supplementation is worth discussing with a clinician if you experience persistent cramping, since blood magnesium tests often miss intracellular depletion.
Thyroid Function Tests and What Fasting Does to Them
TSH, free T3, and free T4 are the standard thyroid panel, and fasting, particularly extended or repeated fasting, can shift these numbers in ways that confuse people who aren’t expecting it. Free T3 in particular tends to drop during prolonged caloric restriction, a conservation response rather than a sign of thyroid dysfunction.
This matters for interpretation more than for alarm. A modest dip in free T3 after a multi-day fast doesn’t necessarily indicate hypothyroidism, and testing thyroid markers in the middle of an extended fast rather than during your normal eating pattern will give you a skewed picture of your baseline thyroid health.
The practical fix is straightforward: if you want a genuine thyroid baseline, test it on a normal eating day, not immediately after a long fast. If you’re doing intermittent fasting with regular eating windows (16:8, alternate-day patterns, or similar), the thyroid impact tends to be far less pronounced than with multi-day extended fasts. Anyone with a pre-existing thyroid condition, or unexplained fatigue, cold intolerance, or weight changes alongside fasting, should get a full thyroid panel checked by a clinician rather than assuming fasting explains every symptom.
Cortisol and Stress Hormone Shifts During Fasting
Cortisol tends to rise during fasting, particularly in the early morning hours and during longer fasting windows, since it’s part of the body’s mechanism for mobilizing glucose and fatty acids when food isn’t coming in. This is a normal, expected response, not evidence that fasting is harming you.
Chronic elevation is the actual concern, not the acute daily rise. If you’re fasting aggressively while also under heavy work stress, sleeping poorly, or training hard, cortisol’s normal fasting bump can stack with baseline stress-driven elevation in ways that undermine the metabolic benefits you’re chasing, sometimes showing up as elevated fasting glucose despite a “clean” eating pattern.
Blood cortisol testing is time-sensitive and easily confounded, so most people don’t need to test it routinely. Symptoms are often a better early signal than a lab draw: persistent poor sleep, irritability, or a fasting protocol that leaves you feeling worse over weeks instead of better is a sign to shorten your fasting window or add more recovery, not push harder. If cortisol dysregulation is suspected clinically, a physician will typically order a morning serum cortisol or a more detailed diurnal salivary panel rather than a single random blood draw.
Kidney Markers: Creatinine and BUN During Fasting
Creatinine and blood urea nitrogen (BUN), the two core markers on a renal panel, can both shift during fasting, and understanding why prevents unnecessary alarm. Creatinine, a byproduct of muscle metabolism, may tick up slightly during extended fasting or with increased protein breakdown, while BUN can rise with dehydration or higher protein intake around your eating window.
A modest creatinine increase during a fast doesn’t automatically mean kidney function is declining. Estimated glomerular filtration rate (eGFR), calculated from creatinine, age, and sex, gives more context than creatinine alone, and a temporary shift that resolves after rehydration and normal eating is generally not a concern.
The BUN-to-creatinine ratio is a useful secondary check for hydration status specifically, since a disproportionately high BUN relative to creatinine often points to dehydration rather than actual kidney impairment. Anyone with pre-existing kidney disease, or anyone taking medications that affect renal function, should have this panel checked before and during any extended fasting protocol, since fasting-related fluid shifts can complicate an already compromised kidney’s workload.
The Monitoring Plan That Actually Matters
Most fasting advice treats blood ketones like a scoreboard, higher is winning, and that’s the wrong lens entirely. BHB in the 0.5 to 1.5 mmol/L range confirms metabolic switching is happening; it doesn’t tell you whether the switching is doing anything meaningful for your metabolic health or longevity. That distinction gets lost constantly.
The marker most people undertrack, fasting insulin, is the one that actually predicts trouble years in advance. If you only have budget or patience for two tests, insulin and HbA1c together tell you more than a ketone meter ever will. Where conventional fasting advice falls short is treating liver enzyme bumps and single ketone readings as verdicts instead of noise that resolves with a repeat test.
Build your first 8 to 12 weeks around consistency, not intensity: same fasting window, same pre-test conditions, same panel repeated on schedule. A structured protocol like the ones ForgeFast builds around habit consistency exists precisely because the biology only works if you actually stick with it long enough to see the trend.
— Tony Lindsay
Sources
Recommended
Comments